Already within the first weeks after the start of the measurements, impressive examples of some of the scenarios which are targeted within goSouth-2 were observed. We list some of them below to provide you with an impression.
Our measurements from 25 August 2025 (see Fig. 1) and 01 September 2025 (see Fig. 2) demonstrate how strong the contrasts in the tropospheric aerosol can be within just a few days. While tropospheric aerosol layers originating from Australia arrived in New Zealand on 25 August, very clean albeit shower-carrying air masses on 01 September originated from the vast Southern Ocean. Contrasting measurements like these were exactly the motivation to do the project in Invercargill because this contrast in air masses can give further insights into the ice-formation characteristics in supercooled clouds. Disentangling the role of temperature, dynamics, aerosol amount and type on ice formation in clouds will help to improve understanding the formation and dissipation of clouds as well as precipitation initiation. In the end, this is important for the radiation budget as well as the water cycle and can improve weather forecast models not only in Invercargill, but worldwide. Weather models tend to have difficulties in simulating clouds in pristine environments that are often found in the southern hemisphere because the models are usually calibrated towards the more polluted northern hemisphere. The measurements in Invercargill can help to explain and resolve the discrepancies.
The measurements also already supported the findings of the EarthCARE satellite that detects a stratospheric aerosol layer in the southern hemisphere. Also, over Invercargill, Polly could detect the relatively optically thin aerosol layer that stems from a volcanic eruption (see Fig. 3). It will be interesting to observe the slow decay of the stratospheric layer.
In the next one and a half years, the scientists of the German and New Zealand institutions will be thrilled to observe further expected and unexpected features about aerosols, clouds, and aerosol-cloud interaction in Invercargill.
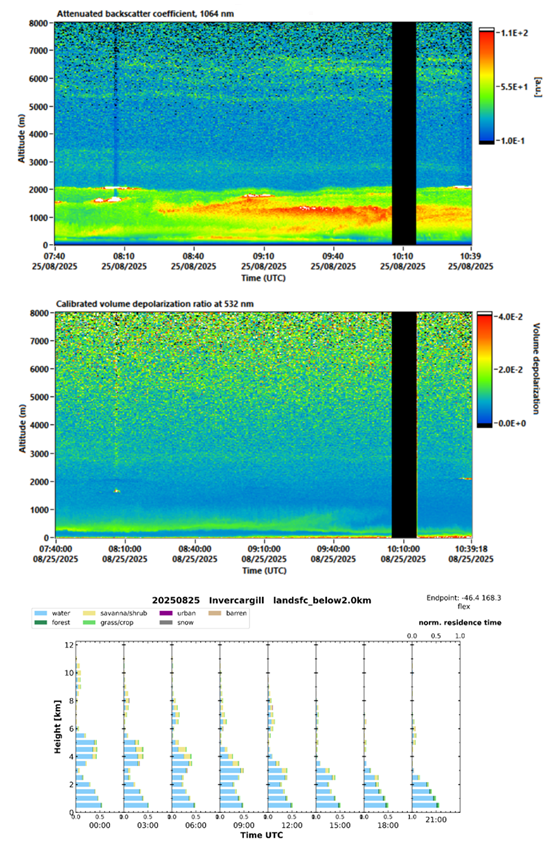
Fig. 1: 25 Aug 2025 Lidar attenuated backscatter cf. and volume depolarization ratio between 7:40-10:40 UTC.
Enhanced aerosol backscatter values in the planetary boundary layer are visible as well as lofted aerosol layers
between 2.5 and 3.5 km height (depolarizing) and between 5.5 and 7 km height (not depolarizing). TRACE data
shows a main contribution of aerosols originating from the ocean, however, the lofted layers have their origin in
savanna/shrub and grass/crop lands over Australia.
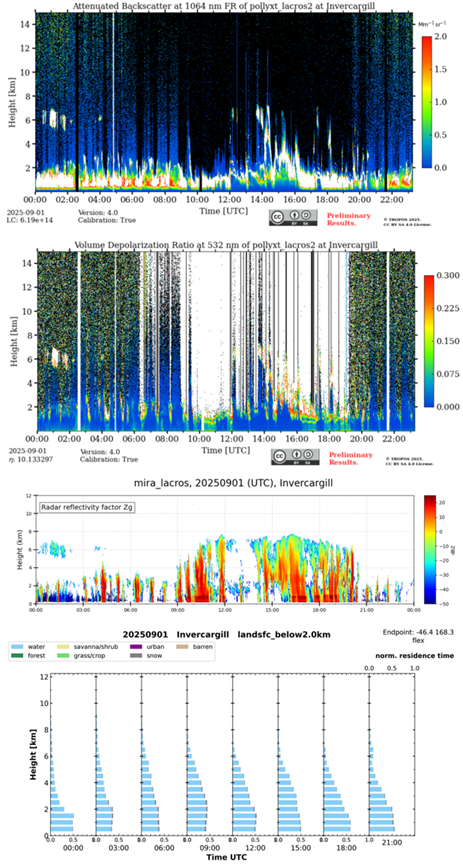
Fig. 2: 01 Sep 2025, very clean air, no lofted aerosol layers visible in the attenuated backscatter
and volume depolarization ratio measurements of the lidar. Many rain showers occurred during
the day, well visible in the radar reflectivity measurements. TRACE shows the dominance of
airmasses originating from water.
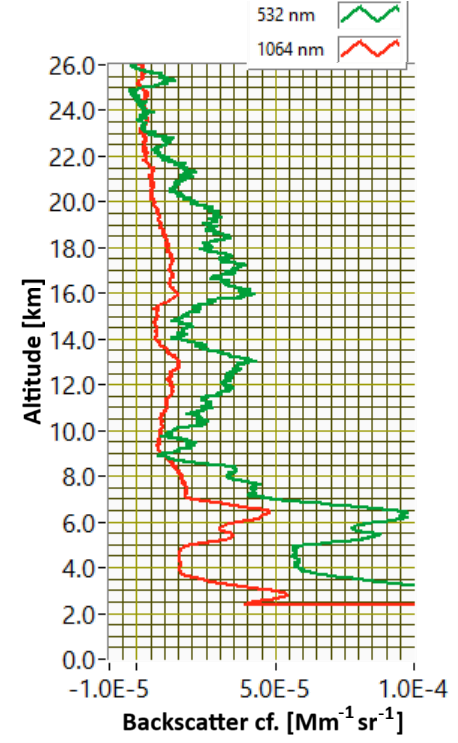
Fig. 3: Backscatter cf. profiles of Polly on 25 Aug 2025, 7:40-10:40 UTC.
Aerosol layer of volcanic origin is visible between around 9 and 23 km height.